Amador County, California sits in the Sierra foothills, wine country east of Sacramento. In the federal government's own compliance record, regulators have taken 56 formal enforcement actions against local facilities there — administrative orders, consent agreements, referrals for violations of the Clean Air Act, Clean Water Act, or federal hazardous-waste law.
Total penalties collected from all 56: $0.
Amador isn't unusual because it has violations. It's unusual because of what happens after — nothing, at least not in dollars. And it isn't alone.
We checked every county in the country
Using EPA's Enforcement and Compliance History Online (ECHO) — the federal government's own facility-level compliance and enforcement database, covering every county, updated roughly quarterly — we looked for counties where regulators had formally acted against a facility and where the total penalties collected sit at exactly zero.
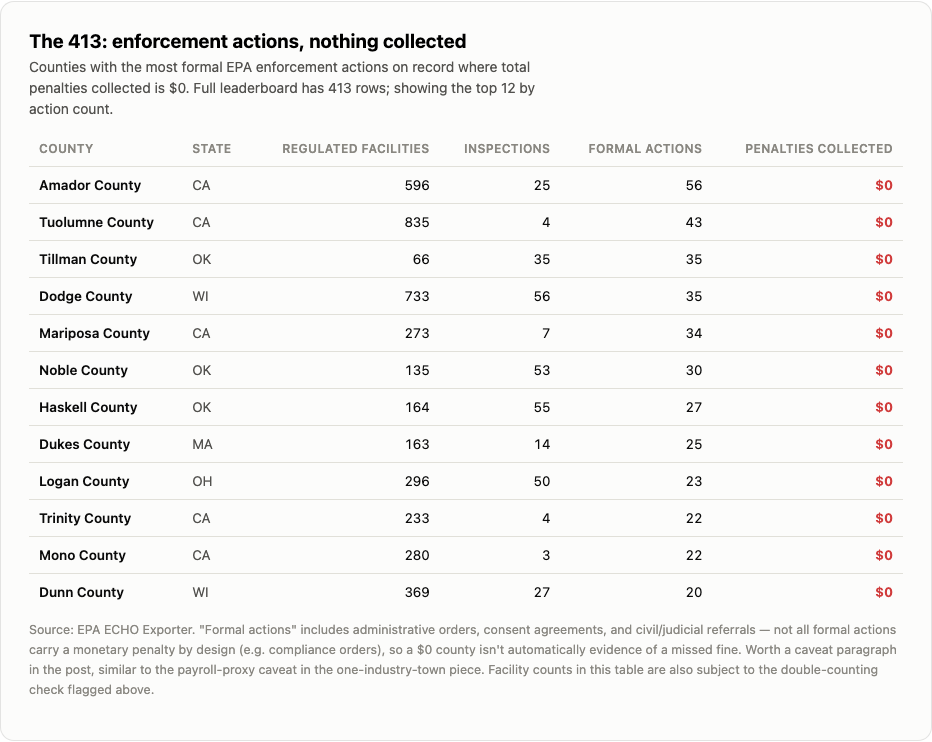
413 of 3,228 counties, 12.8% of the total, have at least one formal enforcement action on record and $0 collected.
That's not 413 counties with no violations. It's 413 counties where the system's own paperwork says "we took action," and the corresponding dollar figure never moved.
The pattern isn't spread evenly. A handful of counties show it over and over:
- Amador County, CA — 56 formal actions, $0 collected
- Tuolumne County, CA — 43 formal actions, $0 collected
- Tillman County, OK — 35 formal actions, $0 collected
- Dodge County, WI — 35 formal actions, $0 collected
- Mariposa County, CA — 34 formal actions, $0 collected
Three of the top five sit one after another along the same stretch of California's Sierra foothills — Amador, Tuolumne, and Mariposa.
It clusters by state, too
Some states show this pattern far more than others. Among states with at least 10 counties that had any enforcement activity, the share where that enforcement collected nothing:
Puerto Rico: 49% — Montana: 42% — Wisconsin: 41% — Kansas: 39% — South Dakota: 39% — Illinois: 38%
In Puerto Rico, essentially every other municipio with an enforcement record on file collected no penalty from it. Illinois shows up here too, but for a different reason than the rest of the list — it has the largest raw count of any state, 38 counties, simply because it's a large state with a lot of enforcement activity overall. The rate tells a different story than the raw count would.
When the money does move, it moves in one direction — hard
The flip side of "zero, again and again" is concentration. When penalties are collected, they land almost entirely on a small number of very large cases. Across every U.S. county, the ten counties with the highest total penalties account for 33% of all penalty dollars collected nationally — from ten counties out of 3,228.
The single largest is Bartholomew County, Indiana, home to Cummins Inc.'s headquarters in Columbus. Cummins settled with the Department of Justice and EPA on January 10, 2024, over a diesel-engine emissions-cheating scheme — $1.675 billion in civil penalties, the largest Clean Air Act penalty ever assessed. That single case is bigger than the next four highest-penalty counties combined.
The other nine biggest are a mix of oil-and-gas counties in New Mexico's Permian Basin — Lea, San Juan, and Eddy — and a scatter of industrial counties from Texas to Michigan to Utah. Nine-figure environmental penalties are rare enough that a single settlement can define a county's entire enforcement record for years.
Three honest limitations
Penalty totals here are cumulative, not annual. EPA's own field is a running total per facility, not a single year's activity, so a county or state total is a cumulative figure across however many years that field spans — not one year's enforcement haul. Treat comparisons across counties and states as relative, not as "this year."
A $0 doesn't always mean a missed fine. Some formal actions — a straightforward compliance order, for instance — don't carry a monetary penalty by design. A county showing $0 despite dozens of actions is a strong screening signal worth asking about, not automatic proof that someone got away with something.
Facility counts need a caveat of their own. EPA's raw compliance file doesn't cleanly separate currently active facilities from historical ones in the fields we're able to pull today, so a facility count alongside these enforcement figures is directional context, not a precise census. The enforcement actions and dollar totals — the actual finding here — aren't affected by that.
What this data can tell you
If you're a local official, compliance officer, or organization trying to understand environmental regulatory exposure in a specific county, region, or sector, this is exactly the kind of pattern that's worth knowing before it shows up in a headline. We built this dataset to cover every U.S. county's EPA enforcement history, and we can run the same breakdown for the place you're responsible for.
If you want to know whether your county's enforcement record is backed by dollars or just paperwork, reach out.
Source: U.S. EPA Enforcement and Compliance History Online (ECHO), Exporter bulk file. Formal enforcement actions and penalty totals are cumulative facility-level fields aggregated to the county level by Peak Data Consulting, not tied to a single calendar year. A facility-identity field is being added to our pipeline in a follow-up pass so future facility counts can be reported with more precision.